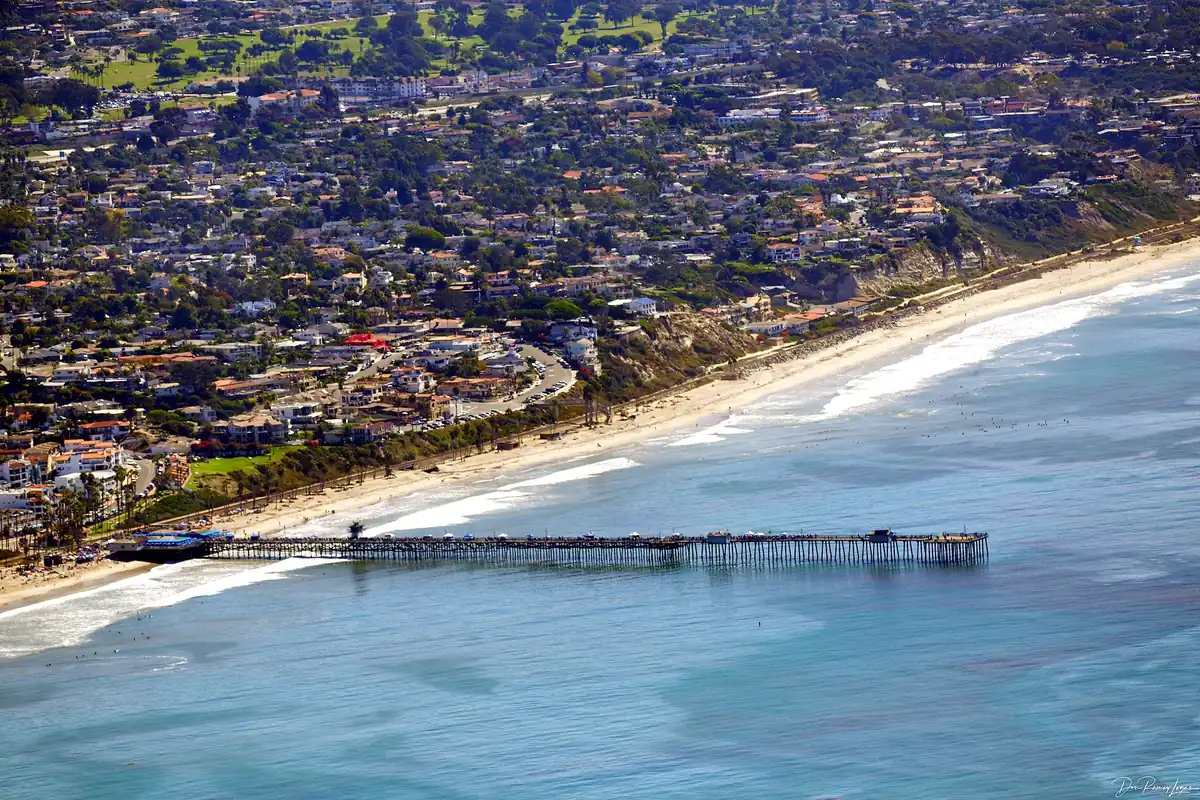
Cabinet Service Area: San Clemente and South Orange County
A compact stretch of coast and inland valley, from Laguna Niguel down to the San Diego County line. Four cities, one of them containing five named neighbourhoods worth treating separately, and a deliberate decision not to claim more than that.
- San Clemente
- Dana Point
- San Juan Capistrano
- Laguna Niguel
- Capistrano Beach
Where we work, and why the area is small
We cover San Clemente, California first, then Dana Point including Capistrano Beach, San Juan Capistrano and Laguna Niguel, plus the named neighbourhoods inside San Clemente itself. That is a short stretch of the South Orange County coast and the valleys behind it, and keeping it short is a deliberate decision rather than a lack of ambition.
Cabinet work has three parts that need somebody physically present: a measured survey before anything is drawn, a scribed installation where fillers are cut on site to follow walls that are not straight, and at least one return visit after the kitchen has been used to adjust hinges and slides that have settled. A contractor covering half of Southern California either drops the third of those or charges every client for the travel to keep it. Working a compact area is what keeps it a normal part of the job.
What actually changes from city to city
Not price. No published source shows a per-city cabinetry price difference across this area, so none is claimed anywhere on this site. The published California band of $500 to $1,200 per linear foot for custom work, and the Los Angeles-area band running to $1,500, apply across the whole of it.
What changes is the housing, and therefore which service is the right answer. A pre-war cottage in North Beach, a mid-century tract kitchen in central San Clemente, a 1990s hillside kitchen in Forster Ranch, a Lantern Village galley in Dana Point and a Talega builder package are five genuinely different problems. The area pages below set out each one.
The four cities, by the numbers
| San Clemente | Laguna Niguel | San Juan Capistrano | Dana Point | |
|---|---|---|---|---|
| Population | 64,293 | 64,355 | 35,196 | 33,107 |
| Housing units | 26,647 | 27,281 | 12,319 | 16,254 |
| Owner-occupied share | 64.0% | 67.1% | 75.8% | 58.6% |
| Median age | 43.9 | 47.0 | 44.1 | 49.8 |
| Median household income, 2023 est. | $134,735 | $140,605 | $127,893 | $127,246 |
| Incorporated | 27 Feb 1928 | 1 Dec 1989 | 19 Apr 1961 | 1 Jan 1989 |
| Land area, sq mi | 18.36 | 14.7 | 14.43 | 6.49 |
Owner-occupied share is of occupied units. Median household income figures are US Census Bureau estimates for 2023; the rest are 2020 decennial census figures. San Clemente and Laguna Niguel are within 62 people of each other in population.
Two rows in that table do real work for a cabinet client. The owner-occupied share runs from 58.6 percent in Dana Point to 75.8 percent in San Juan Capistrano, which is the difference between a market where a lot of cabinetry is being specified for tenants and one where it is being specified for twenty year horizons. And the incorporation dates spread across sixty-one years, which is a rough proxy for when the bulk of each city’s housing went up.
San Clemente, neighbourhood by neighbourhood
The City of San Clemente regulates seven areas through Specific Plans, and it names them itself: Forster Ranch, Marblehead Coastal, Marblehead Inland, Pier Bowl, Rancho San Clemente, Talega and the West Pico Corridor. That list is the most useful map of the city anybody publishes, because each plan area was built in a different decade to a different idea of what a kitchen is.
| Area or era | Typical condition | Usual answer |
|---|---|---|
| Southwest San Clemente and North Beach, pre-war | Plaster, non-standard openings, casework built in place | Custom cabinetry and scribed built-ins |
| Central tract belt, 1950s to 1970s | Eight foot ceilings, a soffit, one drawer bank, suspect sink base | Check the boxes; drawers, soffit decision, often replacement |
| Rancho San Clemente, Forster Ranch, Marblehead Inland, 1980s to 1990s | Sound boxes, working layout, dated raised panel and arched valance | Refacing or refinishing rather than replacement |
| Talega and Marblehead Coastal, 2000s onward | Tall ceilings, competent builder package, nothing failed | Additions: crown to the ceiling, a bar run, drawer conversions, matched built-ins |
| Pier Bowl and the Architectural Overlay District | Mixed, and subject to exterior design review | Whatever the interior needs; the design rules stop at the front door |
The Architectural Overlay District covers the Pier Bowl area, El Camino Real west of I-5, the Downtown Core and North Beach, and it governs street presentation rather than interiors.
Talega has its own page because it represents the newest end of that range and the job there is almost always addition rather than replacement. See cabinets in Talega.
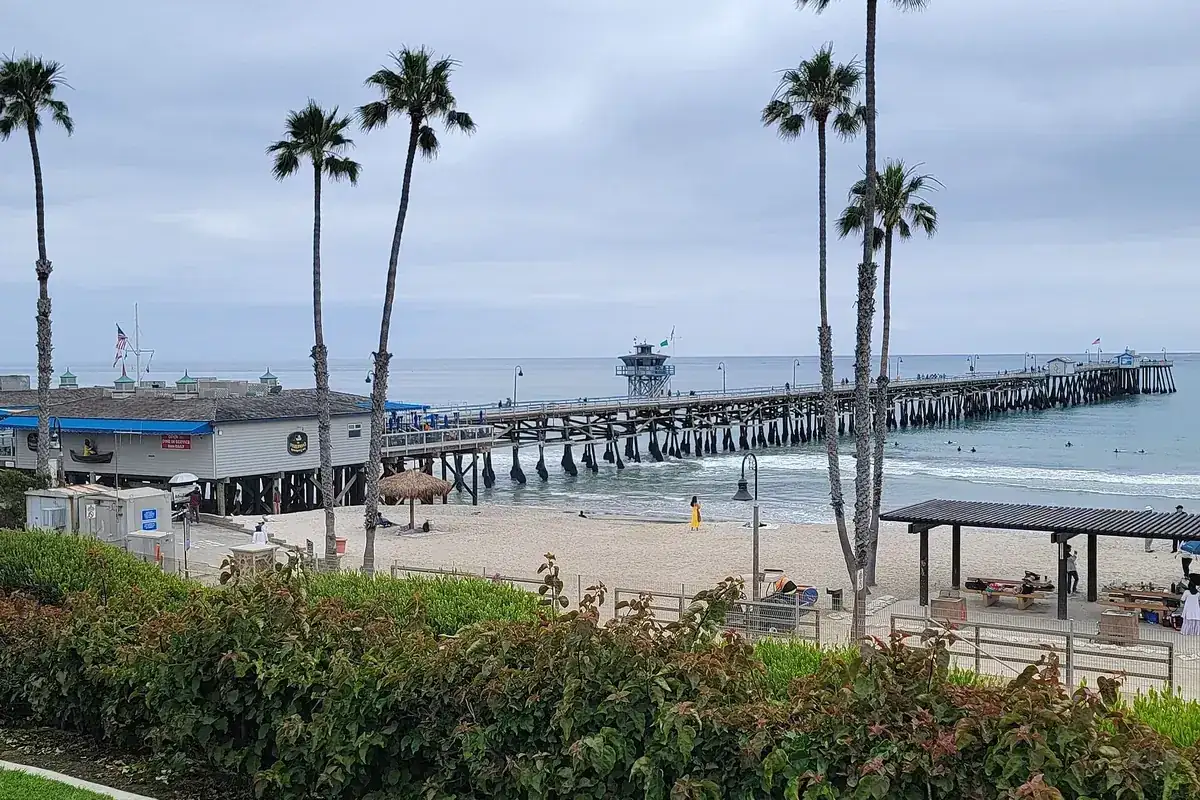
The cities beyond San Clemente
Dana Point, and Capistrano Beach within it
Immediately north along the coast. 33,107 people, incorporated 1 January 1989, 6.49 square miles of land, ZIP codes 92624 and 92629. Its Lantern Village is the dense older core, home to about 12,000 residents, with streets named after the coloured lanterns ships once used in the natural harbour, and its kitchens are small enough that filler strips cost real storage. Dana Point Harbor was built in 1966, and the housing either side of that date differs noticeably.
Capistrano Beach is part of Dana Point and carries its own page, because of a documented run of late 1920s Spanish style houses built by the Capistrano Beach Company whose contractor favoured “large ceiling beams in the main rooms of the houses”. Exposed beams are a genuine constraint on cabinet height and crown termination. See Dana Point and Capistrano Beach.
San Juan Capistrano
Inland and slightly north, 35,196 people, ZIP 92675. Founded on 1 November 1776 with Mission San Juan Capistrano and incorporated 19 April 1961, with the highest owner-occupied share in the service area at 75.8 percent and 96.2 percent of its 12,319 housing units occupied. It has the deepest Spanish Colonial context in the county, which shifts what people ask for rather than what makes a cabinet last. See San Juan Capistrano.
Laguna Niguel
North along the I-5 corridor, with interchanges at Avery Parkway and Crown Valley Parkway. 64,355 people, incorporated 1 December 1989 as Orange County’s 29th city and deliberately without its coastal strip, since Monarch Beach residents voted to join Dana Point instead. Developed by the Laguna Niguel Corporation as one of California’s first master planned communities, which makes it overwhelmingly tract housing and therefore the strongest refacing market in the area. See Laguna Niguel.
Permits: four jurisdictions, four processes
Each city is a separate jurisdiction with its own building department. San Clemente publishes an unusual amount: its own amended exempt-work ordinance, San Clemente Municipal Code 17.04.032, whose building list names “Painting, papering, tiling, carpeting, cabinets, counter tops and similar finish work” as exempt from permit; a homeowner handout on which permit covers what; and its adopted code editions, including the 2025 California Residential Code as SCMC 15.22, effective 1 January 2026.
Dana Point, San Juan Capistrano and Laguna Niguel each run their own process, and Capistrano Beach’s permits go through Dana Point. The consistent California position is that cabinets are finish work and the plumbing, electrical and mechanical work attached to a kitchen is separate, but confirm the specifics with whichever city your address sits in. The San Clemente detail is in the permit and licensing guide.
Housing age across the area, and why it decides the paperwork
The single most consequential difference between addresses in this service area is whether the house was built before 1978, because that is the line the federal Renovation, Repair and Painting Rule draws. It applies to “houses, apartments and child-occupied facilities (such as schools and child care centers) built before 1978” and requires that “Anyone who is paid to perform work that disturbs paint in housing and child-occupied facilities built before 1978 must be certified. This includes all firms, even sole proprietorships.” California has no authorised state programme, so the EPA administers it here directly.
Its exemption covers only “Minor repair and maintenance activities that disturb six square feet or less of paint per room inside, or 20 square feet or less on the exterior,” and window replacement and demolition of painted surfaces are covered regardless of area. A kitchen strip-out is demolition of painted surfaces.
| Area | Typical build era | RRP rule likely to apply? |
|---|---|---|
| Southwest San Clemente, North Beach | 1920s to 1940s | Yes, almost always |
| Capistrano Beach | Late 1920s and mid-century | Yes, almost always |
| Dana Point Lantern Village | Largely pre-harbour, pre-1966 | Yes, usually |
| Central San Clemente tract belt | 1950s to 1970s | Yes, usually |
| San Juan Capistrano | Founded 1776, incorporated 1961 | Yes, in most of the older stock |
| Laguna Niguel | 1960s through 1990s | Depends entirely on the address |
| Rancho San Clemente, Forster Ranch, Marblehead Inland | 1980s and 1990s | No |
| Talega, Marblehead Coastal | 2000s onward | No |
This is a guide to which question to ask, not a determination. The EPA also excludes housing where components have been "declared lead-free by a certified inspector or risk assessor," and lists three testing routes with their qualified users.
The practical version: in the older half of this area, ask every contractor whether they hold EPA RRP firm certification before comparing prices, because a certified firm carries containment, cleanup and verification costs an uncertified one does not. In Talega and the 1990s hillside areas the question does not arise.
Coastal exposure, which is about hardware rather than timber
The second thing that varies across this area is salt exposure, and it is worth being precise about what it damages. The measured moisture environment is mild: the federal Wood Handbook’s nearest listed station to San Clemente is Los Angeles, whose equilibrium moisture content runs from 9.4 percent in January to 11.7 percent in June, a band of only 2.3 points across the whole year. That is a benign environment for wood by national standards.
What does fail near the water is plated steel. Thin decorative plating over steel pits in salt-laden air, then blisters, then lets the steel underneath corrode, and in a hinge or a slide that is mechanical failure rather than a cosmetic one. Solid brass, stainless steel and properly finished zinc all cope.
| Location | Exposure | Specification note |
|---|---|---|
| Capistrano Beach, seaward of PCH | Highest | Solid or stainless hardware throughout |
| Dana Point Lantern Village and harbour side | High | Same |
| Southwest San Clemente, North Beach, Pier Bowl | High | Same |
| Any garage, anywhere in the area | High | The door opens to outside air daily |
| Rancho San Clemente, Forster Ranch hillside | Moderate | Specify well; the risk is lower |
| San Juan Capistrano, inland | Lower | Style can lead the hardware choice |
| Laguna Niguel, San Joaquin Hills | Lower | Style can lead the hardware choice |
| Talega | Lower | Style can lead the hardware choice |
Equilibrium moisture content figures from the USDA Forest Products Laboratory Wood Handbook, Chapter 13, Table 13-1, Los Angeles row. The exposure ranking is a practical judgement about proximity to the water, not a published measurement.
Every service, everywhere in the area
All seventeen services on the services hub are offered across the whole area, with custom cabinets as the main one.
The four cities’ housing stock, from the Housing Element datasets
Each of the four cities published a Housing Element dataset that describes its own housing stock, and putting the four side by side explains almost everything about why the same cabinet job costs and looks different from one to the next. The source is the SCAG Pre-Certified Local Housing Data, updated April 2021, prepared separately for each city’s 6th Cycle Housing Element Update, drawing on California Department of Finance E-5 estimates and American Community Survey 2014-2018 five year estimates. These are the figures each City Council used to write its own Housing Element, which makes them the least arguable numbers available.
| San Clemente | Laguna Niguel | San Juan Capistrano | Dana Point | SCAG region | |
|---|---|---|---|---|---|
| Total housing units | 26,573 | 26,236 | 12,558 | 16,172 | n/a |
| Single-family detached units | 15,208 | 14,527 | 6,797 | 8,801 | n/a |
| All single-family share | 67.1% | 74.8% | 73.5% | 67.2% | 61.7% |
| Single-family attached | 9.8% | 19.5% | 19.4% | 12.8% | 7.2% |
| Multifamily, 2 to 4 units | 15.7% | 5.4% | 6.8% | 16.5% | 7.5% |
| Multifamily, 5 or more units | 15.0% | 19.6% | 8.6% | 14.7% | 27.3% |
| Mobile homes | 2.3% | 0.2% | 11.1% | 1.5% | 3.5% |
| Occupied units | 24,337 | 24,869 | 11,870 | 14,113 | n/a |
| Total vacancy rate | 8.4% | 5.2% | 5.5% | 12.7% | n/a |
| Average household size | 2.642 | 2.609 | 3.052 | 2.332 | n/a |
| Owner-occupied share, ACS 2014-2018 | 66.3% | 70.0% | 74.9% | 61.4% | 52.5% |
| 2018 median home sales price | $970,000 | $800,000 | $834,000 | $940,000 | n/a |
| Change in median price since 2000 | +149% | +145% | +203% | +161% | +151% |
Every figure in this table is from the SCAG Pre-Certified Local Housing Data, updated April 2021, prepared for the named city's 6th Cycle Housing Element Update. Median sales prices are for existing homes, from SCAG Local Profiles and Core Logic / Data Quick. The owner-occupied shares here are ACS 2014-2018 five year estimates and therefore differ slightly from the 2020 decennial figures in the earlier table; both are given with their vintage rather than blended into one number.
Four rows in that table change what we quote. San Juan Capistrano’s 11.1 percent mobile home share is more than three times the regional figure and by far the highest here, which means manufactured home cabinetry is a routine job in that city and a rare one in the others. Dana Point’s 12.7 percent vacancy rate is second homes rather than a soft market, and it pushes hardware specification harder than anywhere else in the area. San Juan Capistrano’s average household size of 3.052 people is three quarters of a person larger than Dana Point’s 2.332, which shows up as pantry and laundry demand rather than as display cabinetry. And Laguna Niguel and San Juan Capistrano both carry around 19.5 percent single-family attached against 7.2 percent regionally, which means narrow kitchens, walls that cannot come out and a maximum carcass size set by a stair.
| Year built | San Clemente | Laguna Niguel | San Juan Capistrano | Dana Point | SCAG region |
|---|---|---|---|---|---|
| 2014 and later | 0.9% | 0.8% | 1.2% | 0.2% | 1.0% |
| 2010 to 2013 | 0.8% | 0.7% | 2.3% | 0.1% | 1.5% |
| 2000 to 2009 | 19.2% | 4.7% | 7.5% | 4.9% | 10.1% |
| 1990 to 1999 | 10.8% | 24.2% | 14.2% | 8.4% | 9.5% |
| 1980 to 1989 | 19.4% | 44.5% | 16.3% | 28.7% | 15.0% |
| 1970 to 1979 | 21.7% | 17.7% | 39.6% | 32.1% | 16.3% |
| 1960 to 1969 | 15.2% | 5.5% | 13.9% | 16.6% | 14.5% |
| 1950 to 1959 | 7.9% | 1.2% | 2.7% | 7.0% | 15.9% |
| 1940 to 1949 | 2.5% | 0.2% | 0.6% | 1.0% | 6.9% |
| 1939 and earlier | 1.5% | 0.5% | 1.7% | 0.8% | 9.3% |
Shares from each city's SCAG Pre-Certified Local Housing Data, citing American Community Survey 2014-2018 five year estimates. Columns are the share of that city's total housing units and each sums to approximately 100 percent.
That second table is the single most useful page of data in this service area, because it turns the 1978 question from a guess into arithmetic. Adding the pre-1980 bands gives 48.8 percent for San Clemente, 25.1 percent for Laguna Niguel, 58.5 percent for San Juan Capistrano and 58.5 percent for Dana Point. So in San Juan Capistrano and Dana Point the federal lead rule is the default assumption and the exception is a newer address; in Laguna Niguel it is the other way round; and San Clemente is close to an even split, which is exactly why it is the city where the question has to be asked every time.
The shapes are also genuinely different from one another rather than variations on a theme. Laguna Niguel is a two-decade tract city with 68.7 percent of its housing from 1980 to 1999. San Juan Capistrano peaks at 39.6 percent in the single decade of the 1970s. Dana Point peaks across the 1970s and 1980s at a combined 60.8 percent. San Clemente is the only bimodal one, with 21.7 percent from the 1970s and a second peak of 19.2 percent from 2000 to 2009, which is the Talega and Marblehead build-out. Four cities within nine miles of each other, four different answers to what era of kitchen you are most likely to be standing in.
One row deserves a specific note. Every one of these four cities is dramatically under-represented in pre-1950 housing compared with the SCAG region, which carries 16.2 percent from before 1950 against 4.0 percent in San Clemente, 0.7 percent in Laguna Niguel, 2.3 percent in San Juan Capistrano and 1.8 percent in Dana Point. South Orange County is a postwar region with small pockets of older housing, and those pockets, Southwest San Clemente, North Beach, Capistrano Beach and the Historic Town Center, are where drawn cabinetry stops being a preference and becomes the only thing that fits.
What is identical everywhere in the area
Three sets of rules do not vary from city to city here, and they are the ones that actually protect a homeowner, so they are worth knowing wherever your address is.
The contract rules.California Business and Professions Code 7159 applies wherever “the aggregate contract price specified in one or more improvement contracts, including all labor, services, and materials to be furnished by the contractor, exceeds five hundred dollars ($500),” and requires that “A home improvement contract and any changes to the contract shall be in writing and signed by the parties to the contract prior to the commencement of work.” Changes as well as the original contract, which means a verbal change order is not a change order.
The deposit cap.Business and Professions Code 7159.5(a)(3): “If a downpayment will be charged, the downpayment shall not exceed one thousand dollars ($1,000) or 10 percent of the contract amount, whichever amount is less.” Subdivision (a)(5) adds that beyond the deposit a contractor “shall neither request nor accept payment that exceeds the value of the work performed or material delivered.” Because the statute takes the lesser figure, the cap is ten percent below a $10,000 contract and a flat $1,000 above it.
The licence.Business and Professions Code 7048 exempts unlicensed work only where the aggregate contract price for labour, materials and all other items is under $1,000, the work is “of casual, minor, or inconsequential nature,” and it “does not require a building permit.” All three conditions have to hold at once, and a cabinet job clears the threshold many times over. The specialty classification is CSLB C-6, Cabinet, Millwork and Finish Carpentry, and any number can be checked on the Board’s public lookup in about ninety seconds.
| Contract amount | Ten percent | Legal maximum deposit |
|---|---|---|
| $3,000 | $300 | $300 |
| $8,000 | $800 | $800 |
| $10,000 | $1,000 | $1,000 |
| $20,000 | $2,000 | $1,000 |
| $45,000 | $4,500 | $1,000 |
Arithmetic on the statutory text of Business and Professions Code 7159.5(a)(3). Applies in every city in this service area and everywhere else in California.
Also identical everywhere here: the South Coast Air Quality Management District’s coatings rules, since all four cities sit inside its four-county jurisdiction, and California’s formaldehyde limits on composite wood panels. Neither varies by municipality. The detail is in the finishes guide and the box materials guide.
Service area: frequently asked questions
Which cities do you cover?
San Clemente first, then Dana Point including Capistrano Beach, San Juan Capistrano and Laguna Niguel, plus every named neighbourhood inside San Clemente itself. That is a compact stretch of the South Orange County coast and inland valleys, roughly from Laguna Niguel down to the San Diego County line, and keeping it compact is deliberate rather than modest.
Why keep the service area small?
Because cabinet work needs a measured survey, a scribed installation and at least one return visit to adjust doors after the room has been used. A contractor covering four counties either skips the return visit or charges everybody for the travel. The four cities on this page sit within a short run of each other, which is what makes the adjustment visit a normal part of the job rather than a favour.
Do you work outside these cities?
Sometimes, and it is worth asking. Ladera Ranch, Rancho Mission Viejo, Mission Viejo, Laguna Beach and Aliso Viejo are all within reach, and jobs there get looked at on their merits. What we will not do is claim coverage of somewhere we would not realistically service properly, because a cabinet job that outruns its installer is worse than one that never started.
Does the area change what things cost?
No published source shows a per-city price difference across this stretch of South Orange County, so none is claimed. The same published California band of $500 to $1,200 per linear foot for custom cabinetry applies across the whole area, with the Los Angeles band running to $1,500. What genuinely differs city to city is the housing stock, which changes which service you need rather than what a linear foot costs.
Do permit rules differ between these cities?
Yes, because each is a separate jurisdiction. San Clemente publishes its own amended exempt-work ordinance and its own adopted code editions, which is unusually helpful. Dana Point, San Juan Capistrano and Laguna Niguel each have their own building departments and their own processes. Capistrano Beach is part of Dana Point, so its permits go through Dana Point rather than San Clemente.
Which parts of the area are hardest on cabinets?
Anywhere within a few blocks of the water, and every garage. The failure is hardware rather than timber: thin decorative plating over steel pits in salt air and then lets the steel corrode until hinges and slides stiffen. The Dana Point Lantern Village, Capistrano Beach and the seaward parts of San Clemente are the most exposed, and a garage anywhere in the area exchanges air with the outside every day.
How much of each city in your service area predates 1978?
Roughly 58 percent in San Juan Capistrano and Dana Point, 49 percent in San Clemente and 25 percent in Laguna Niguel. Adding the pre-1980 bands in each city's SCAG Pre-Certified Local Housing Data for its 6th Cycle Housing Element Update gives 48.8 percent for San Clemente, 25.1 percent for Laguna Niguel, 58.5 percent for San Juan Capistrano and 58.5 percent for Dana Point. So in the two older cities the federal lead rule is the default assumption and a newer address is the exception; in Laguna Niguel it is the other way round; and San Clemente is close to an even split, which is why the question gets asked on every job there.
Which city in the area has the newest housing?
Laguna Niguel, by a wide margin, and it is a two-decade city rather than a gradual one. Its SCAG Pre-Certified Local Housing Data puts 44.5 percent of its 26,236 units in 1980-1989 and 24.2 percent in 1990-1999, so 68.7 percent of the city was built in twenty years, against 24.5 percent across the SCAG region for the same period. Only 7.4 percent predates 1970. Dana Point peaks earlier at a combined 60.8 percent across the 1970s and 1980s, San Juan Capistrano peaks hardest of all at 39.6 percent in the single decade of the 1970s, and San Clemente is the only bimodal one, with 21.7 percent from the 1970s and 19.2 percent from 2000-2009.
Do the four cities differ in what they ask us to build?
Yes, and the housing data explains most of it. San Juan Capistrano has 11.1 percent of its units as mobile homes, more than three times the regional figure, so manufactured home cabinetry is routine there and rare elsewhere. Dana Point has a 12.7 percent vacancy rate with 69.6 percent of vacant units seasonal, which is second homes and pushes hardware specification harder than anywhere else here. San Juan Capistrano's average household size of 3.052 people against Dana Point's 2.332 shows up as pantry and laundry demand. And Laguna Niguel and San Juan Capistrano both carry around 19.5 percent single-family attached against 7.2 percent regionally, which means narrow kitchens and walls that cannot come out.
If your address is in the area, the survey is free
Somebody comes out with a tape, measures the room properly and sends back an itemised written scope. No showroom, no deposit before a signed contract.
Request a Free Quote